Data Visualization
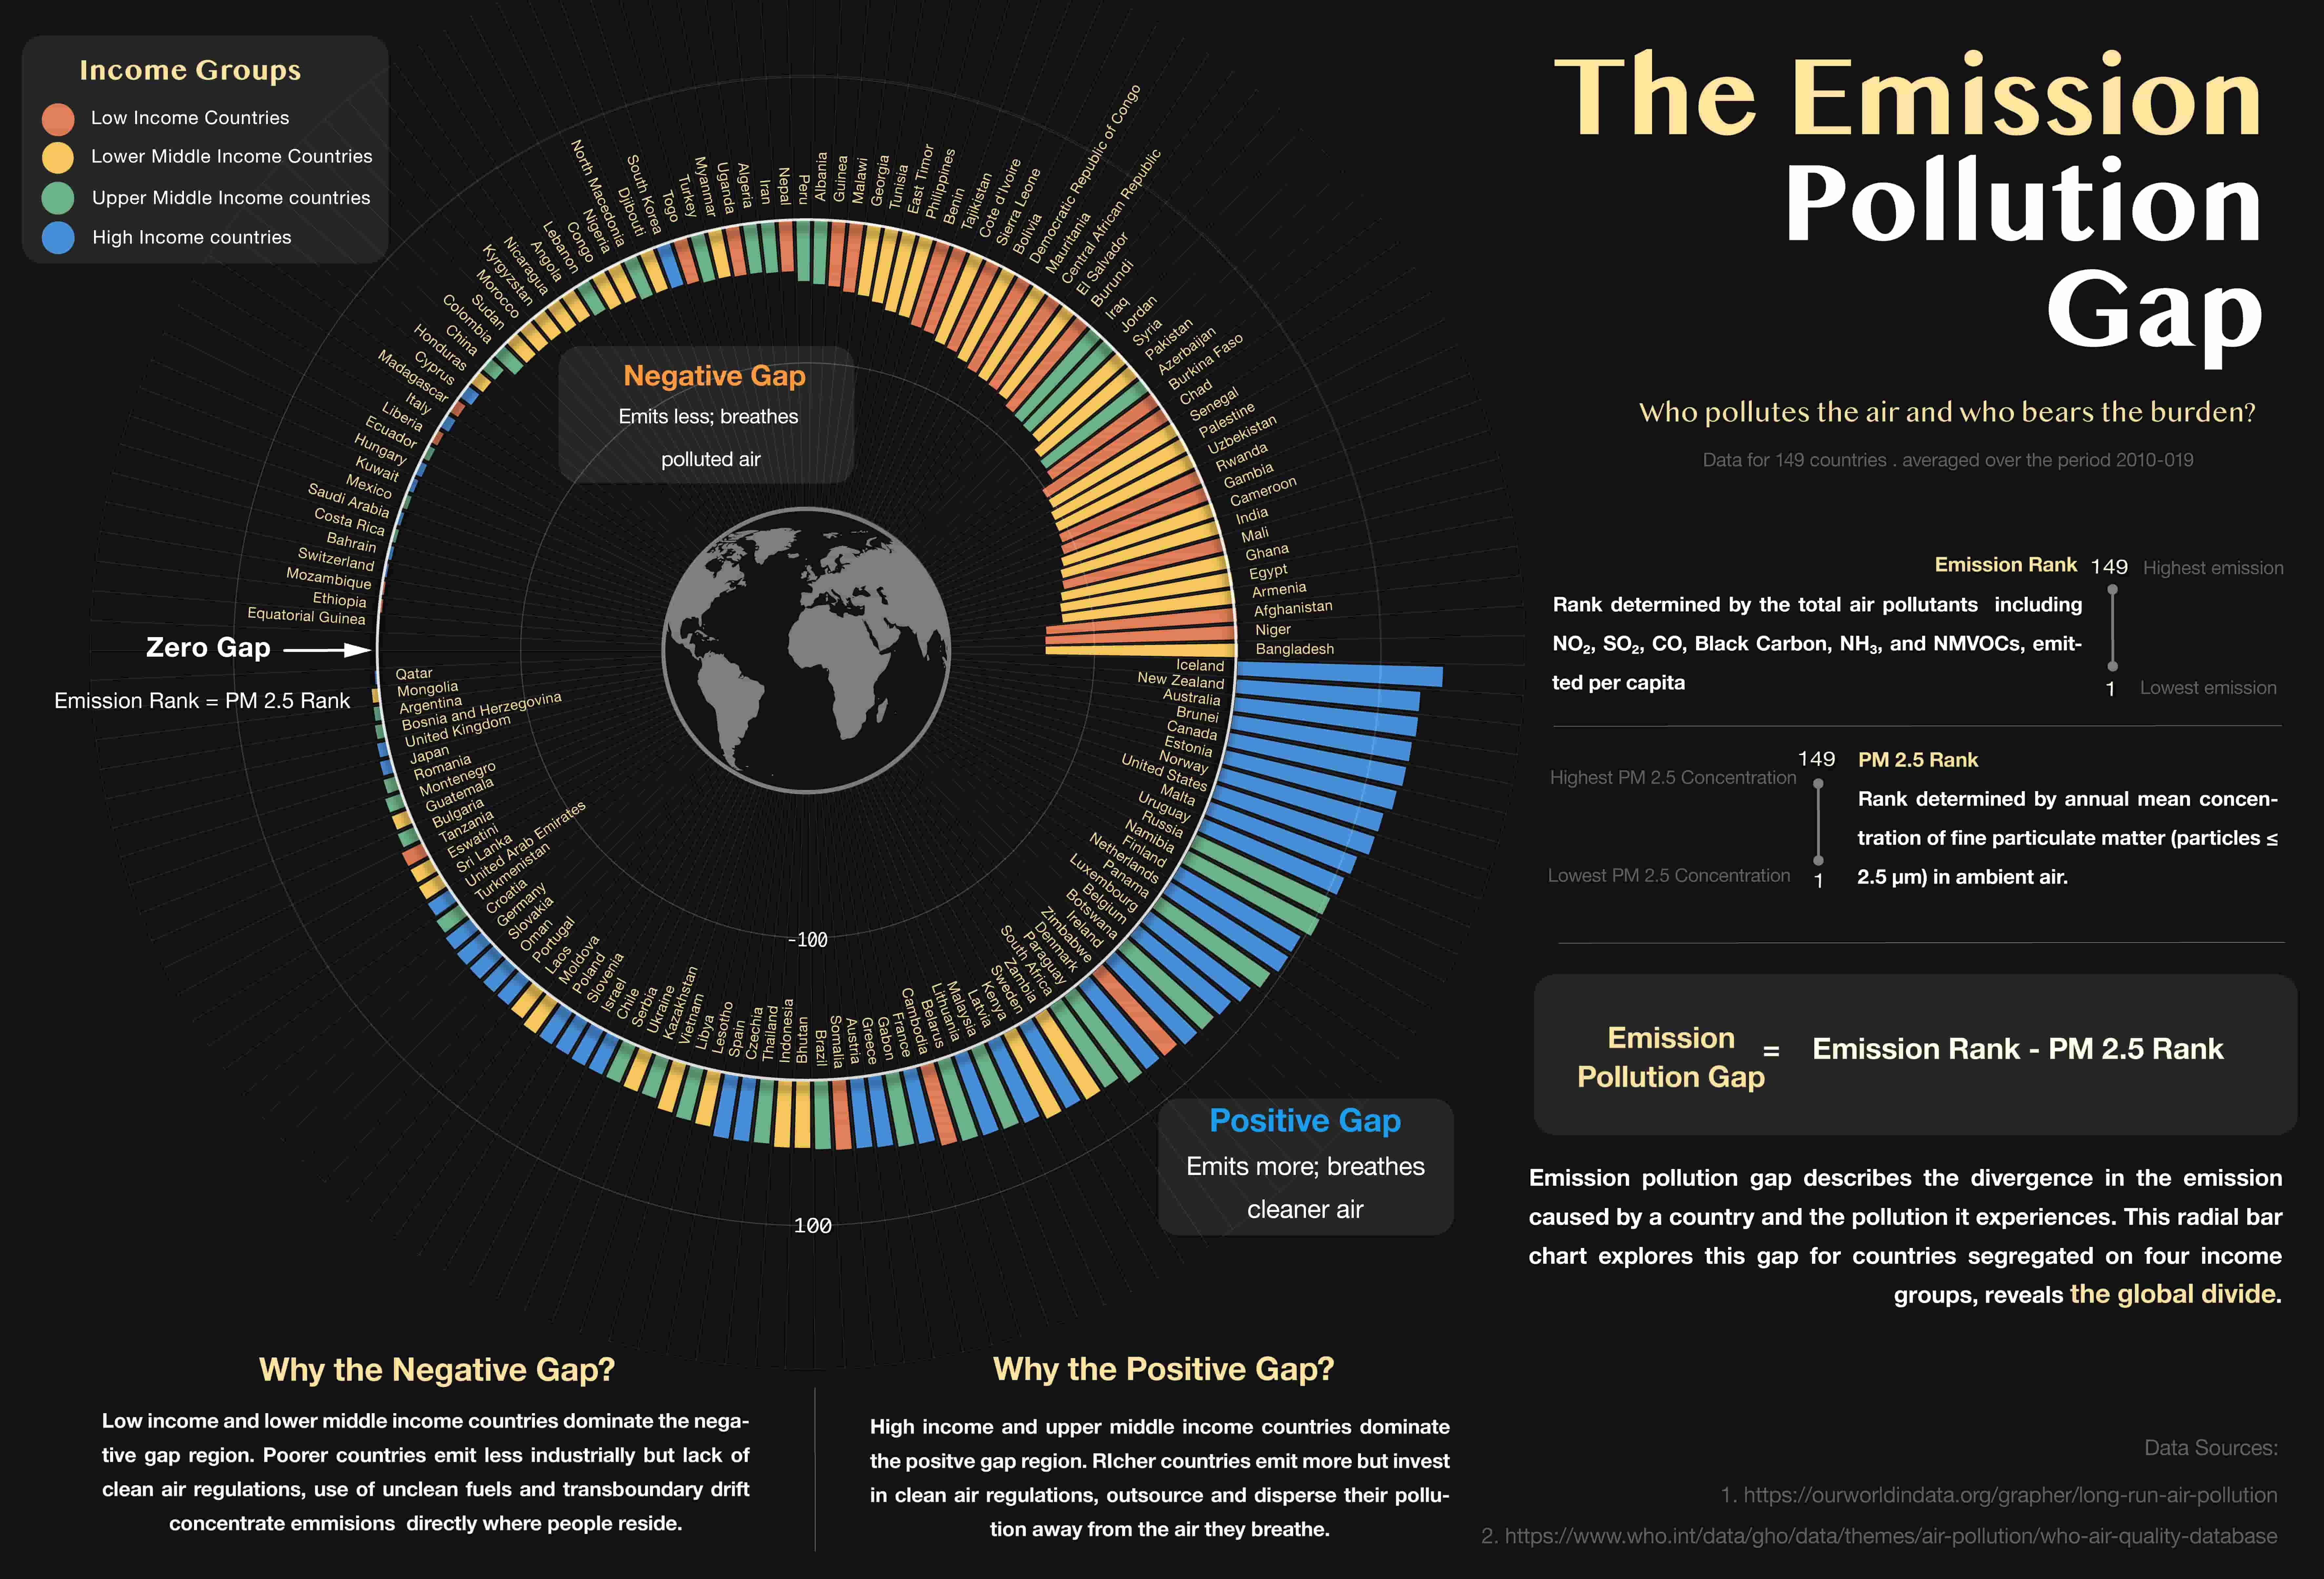
The Emission Pollution Gap
Who pollutes the air — and who bears the burden? An interactive dashboard and editorial infographic across 149 countries.
View live dashboard ↗Portfolio
Scientific illustration and data visualization across research, publishing, and education.
Who pollutes the air — and who bears the burden? An interactive dashboard and editorial infographic across 149 countries.
View live dashboard ↗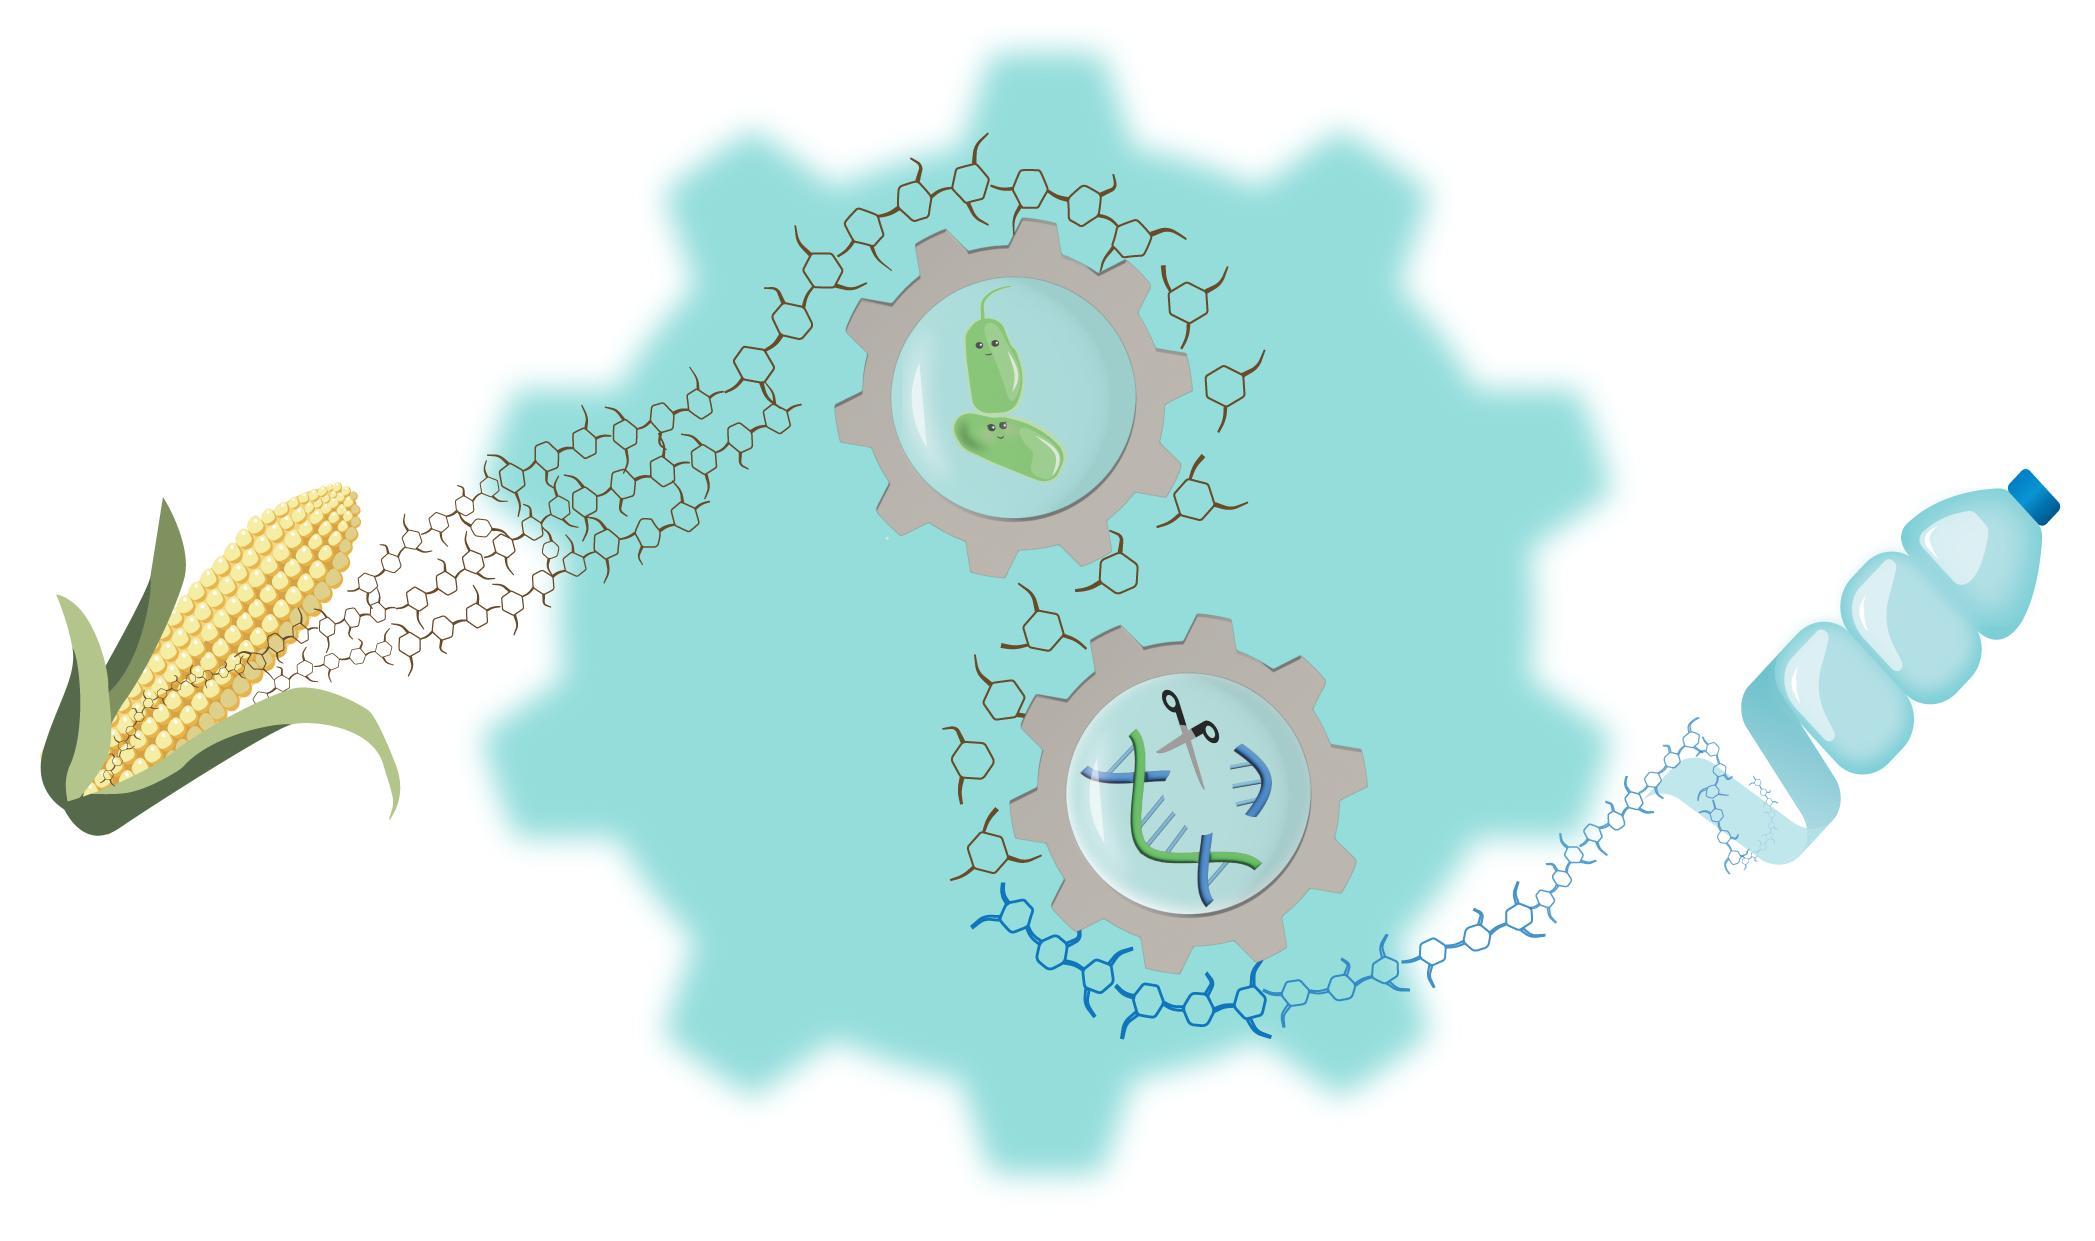
Schematic designed for thesis titled 'Bioconversion of Lignin-related aromatics to Cis, cis-Muconic acid using Acinetobacter baylyi ADP1'.
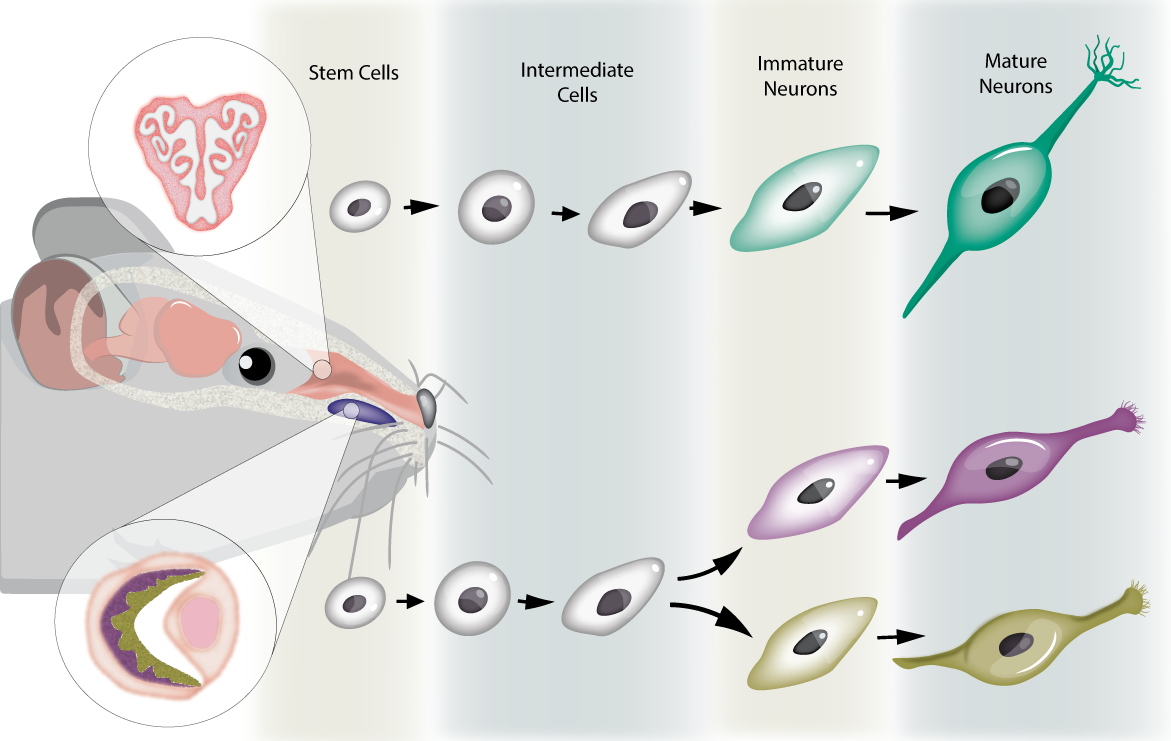
Divergence in development of neurons in the olfactory epithelium and vomeronasal organ in mice.
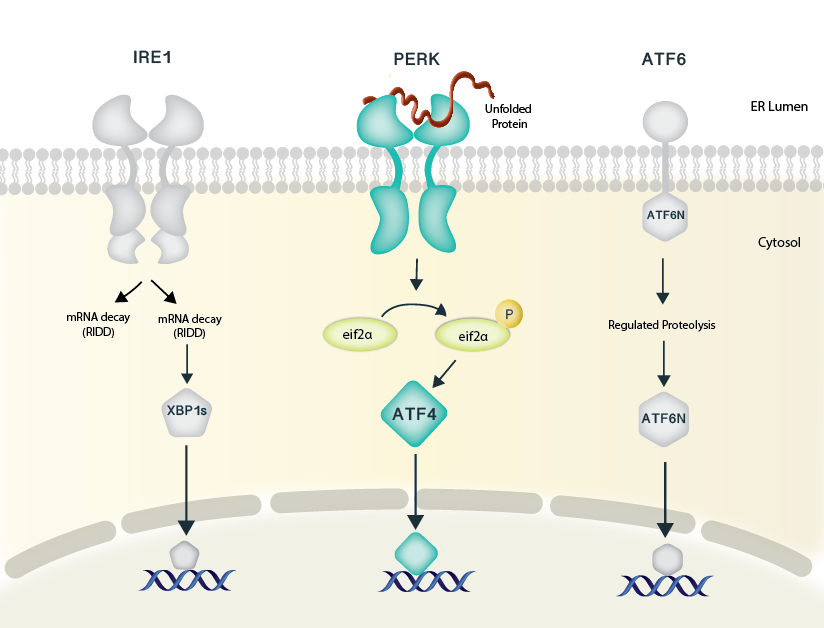
The three branches of the unfolded protein response.
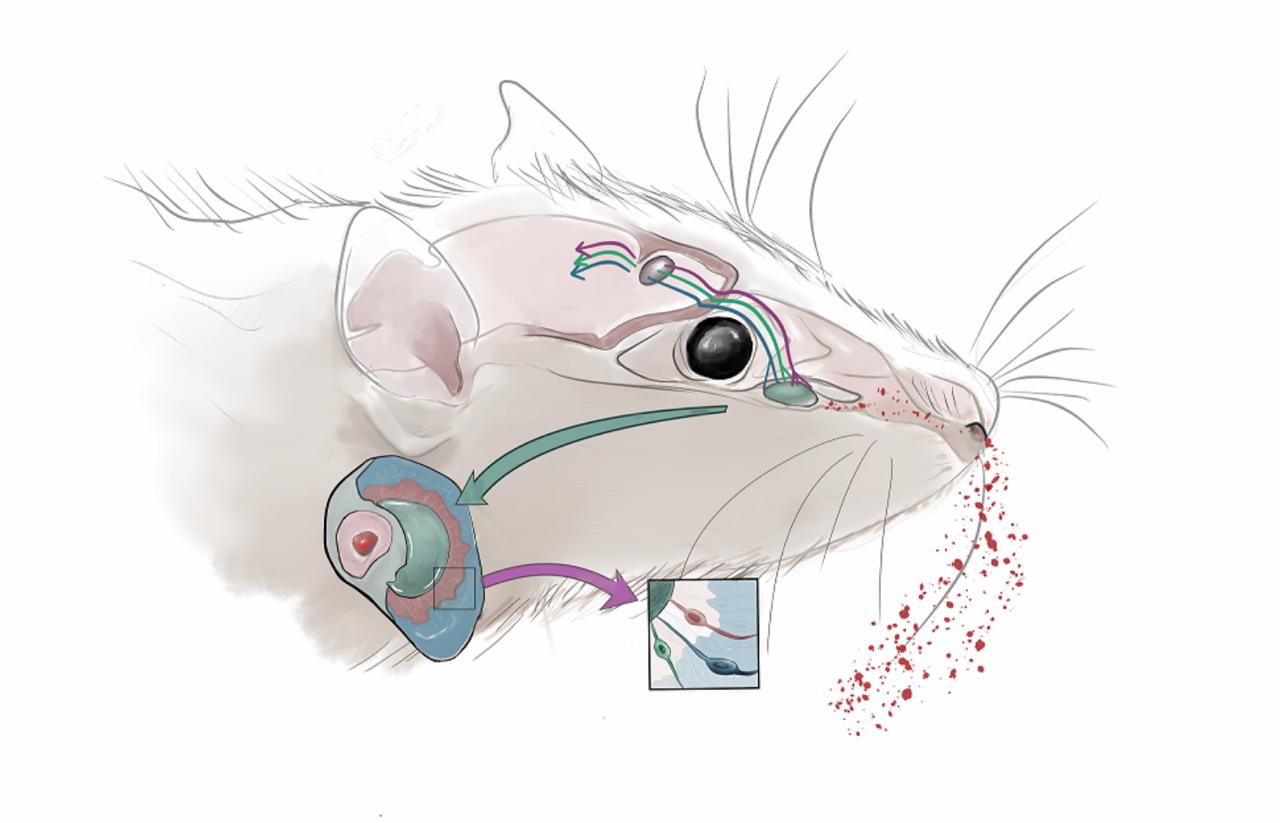
Pheromone processing in the mouse vomeronasal organ.
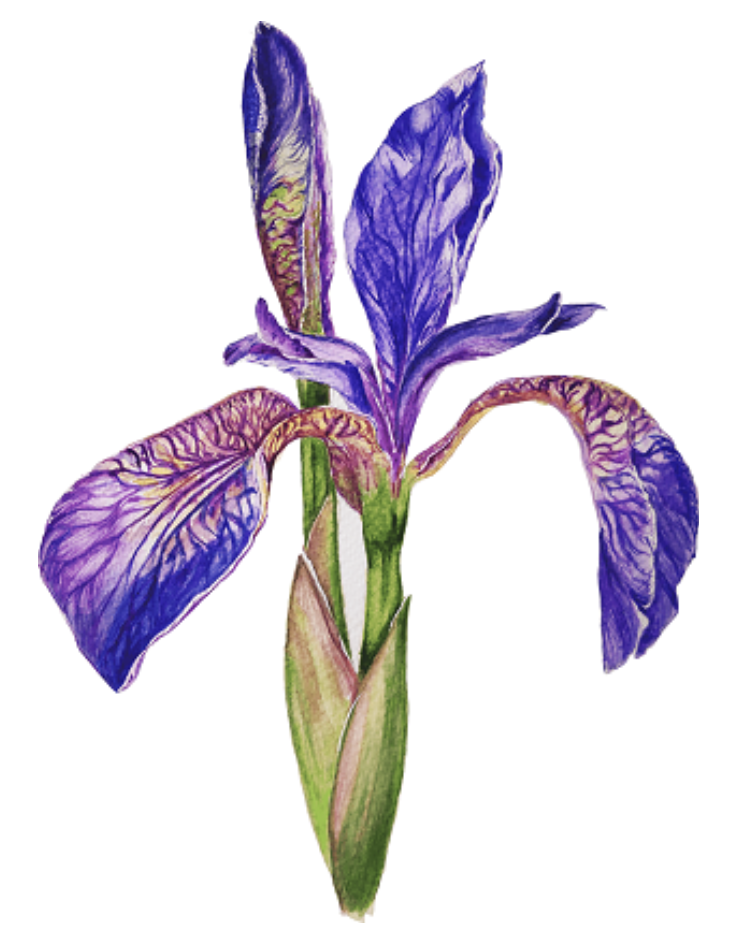
A collection of botanical illustrations. Click to browse the series.
View series →